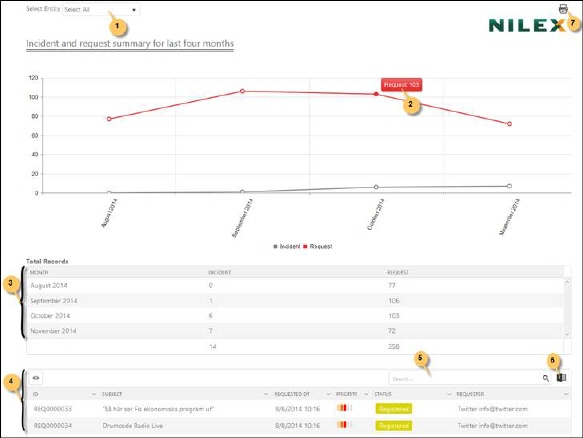
This report includes tickets of type Incident and/or Request created in the last four completed months (means that e g the report is displayed anytime in December, the report displays data for August-November):

Incidents and Requests Last Four Months
This report contains a graph which displays incidents and/or requests created in the last four months. X-axis of the graph displays months and y-axis displays the count. Mouse over a point displays ticket type and count for the respective month (2). The report is displayed for the four latest finished month. Current month is not included.
You can filter the data of the report by selecting the ticket type from the dropdown list displayed above the graph (1). By default, all types (both Incident and Request) are displayed.
A summary of the tickets represented in the graph is displayed in a list just below the graph (3). Each row in a list contains Month and tickets count for the respective ticket type in that month.
All tickets filtered for the date interval (last four month) are initially displayed in the list below the graph (4). The list provides a search box (5) and export to excel button (6).
Use Print button (7) to open the print utility. You can do required changes and make a print out of the report.