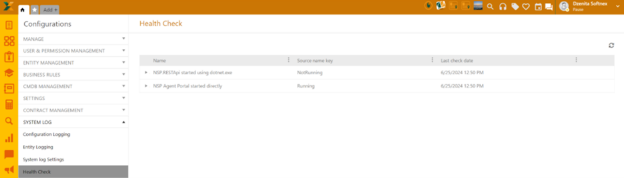
Health Check is a performance overview of the NSP application and installed and mapped Windows services.
Setup instructions
To set the health check, the following code needs to be added to the appsettings.json of the NSP.ServiceAgent project.
"Agent": {
"InstanceName": "Dev",
"SelfUrl": "http://localhost:5000"
},
Note: The Service Agent controls all services of one computer. For each machine used on one computer, a service agent needs to be set up. For example, if 5 machines serve one agent, 5 service agents are needed.
When Service Agent is run, it immediately contacts and registers at maintenance host at the endpoint http://localhost:12121.
Note that each instance's name and SelfUrl needs to be unique.
Health Check can be used and set for Windows and non-Windows services.
By default, the appsetting.json file includes NSP REST and Web services.
"NSPServices": [
{
"Key": "REST",
"ServiceOrExecutableName": ".*dotnet\"?(.exe\"?)? .*NSP.RESTApi.dll",
"Description": "NSP.RESTApi started using dotnet.exe",
"IsWindowsService": false
},
{
"Key": "Web",
"ServiceOrExecutableName": "NSP.Web.exe",
"Description": "NSP Agent Portal started directly",
"IsWindowsService": false
}
As you can see from the code, the services can be started in several ways.
For Windows services, make sure that the services you are trying to include for the health check overview are already installed on your machine. Otherwise, you won’t be able to run the project. For more information on how to install the Windows services, see tutorial.
Example of Windows services in the appsettings.json:
"NSPServices": [
{
"Key": "AC",
"ServiceOrExecutableName": "NSP.EntityAccessControlService",
"IsWindowsService": true,
"Description": "Entity Access Control Service"
},
{
"Key": "FTSE",
"ServiceOrExecutableName": "NSP.FtseService",
"Description": "Full Text Search Engine Service",
"IsWindowsService": true
},
Health check overview
To check the app health, go to:
Configurations > System log > Health Check
Here you’ll see the grid will the following information:
1. Service name
2. Status
3. Last check date
Health check service list
When you click on the service, for example, NSP Agent Portal, you’ll see the application’s current CPU usage, Memory usage, and Start time. You can also view the logs if enabled.
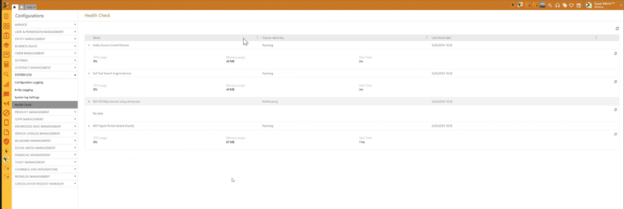
NSP Agent Portal: Health Check overview
Window services such as Entity Access Control Service or FtseService (or any Windows service you add in the json file) have additional grid action options, including:
1. Stop
2. Restart
3. View logs (see more in the next section).

Health Check: Grid actions
Enabling logs
Logs overview is disabled by the default settings.
To enable this view, open the MS SQL Server Management Studio, and go to Databases / NSP / Tables / app.GlobalSettings/ Edit / HealthCheckLogsEnabled and now change the settings from false to true. After this change, the application project needs to be restarted.
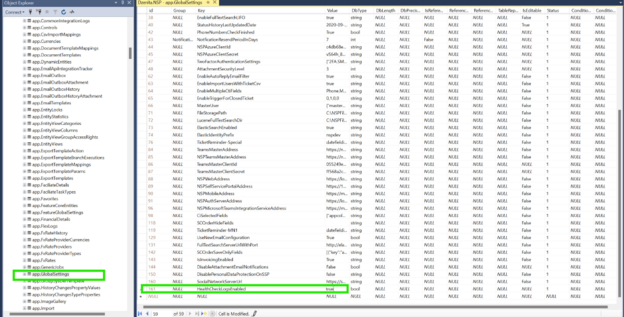
SQL Management Studio: Enabling logs
Now you will be able to see the logs by using the dropdown grid option View log.
Clicking on View Logs opens a new form, where you can choose the source i.e. the log file and you’ll see the list of the latest system information. On expand, you’ll see the message related to the log or the exception information, if existent.
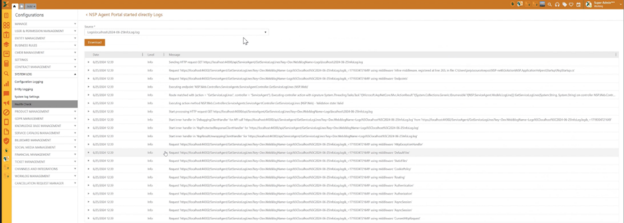
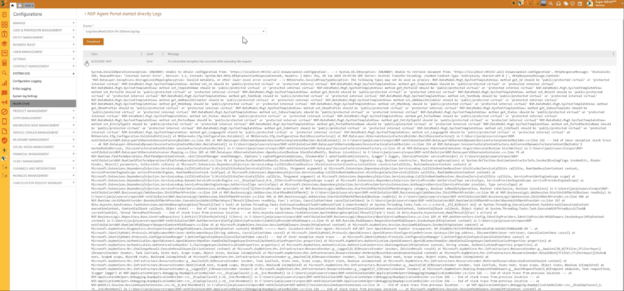
View logs