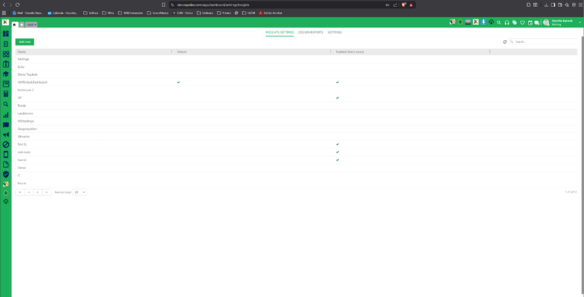
Insights in NSP provides a configurable dashboard area where organizations can present key figures, charts, and other report elements to users. The feature is available from Configuration > Manage > Insights, and it is intended for administrators who want to design and publish dashboards based on NSP data.
1. Insights Settings - Manage available Insights dashboards, default selection, and direct access options.
2. Design Reports - Build or edit the report template that will be used as the dashboard layout.
3. Settings - Manage the token and restore the default template and datasource files.
Before creating a dashboard, it is important to make sure that the required report template and datasource files are available and that a valid token exists on the Settings tab. The token is used when configuring report data sources.
Starting point: A practical sequence is to first verify the token and default files on the Settings tab, then prepare the datasource in Design Reports, and finally create or edit the Insight entry in Insights Settings.
|
Tab |
Purpose |
Typical actions |
|
Insights Settings |
Create and maintain dashboard entries visible in NSP. |
Add new, edit existing entries, delete, set default, enable direct access. |
|
Design Reports |
Design the report layout and bind it to shared datasources. |
Create a blank report, create from template, assign data source, set item properties, preview. |
|
Settings |
Manage the technical prerequisites used by report datasources. |
Copy the token, create a new token, override files with the default template and datasource. |
Insights Settings
The Insights Settings tab lists all configured dashboards. From this page, the administrator can add new entries, mark one dashboard as default, and enable direct access for dashboards that should be published through a shareable URL.
Configuration: Insights Settings
Add new and edit an Insight
Use Add new to create a new dashboard entry, or use Edit from the row actions to update an existing one. The form contains the following fields:
•Name: the display name of the Insight in NSP.
•Design template name: the report template file that will be used for the dashboard.
•Description: an optional description for administrators or users.
•Show toolbar: displays the report viewer toolbar in the dashboard view.
•Enable auto update: allows the dashboard to refresh automatically when supported by the setup.
After the fields are completed, click Next and continue with the remaining configuration steps until the Insight is saved.
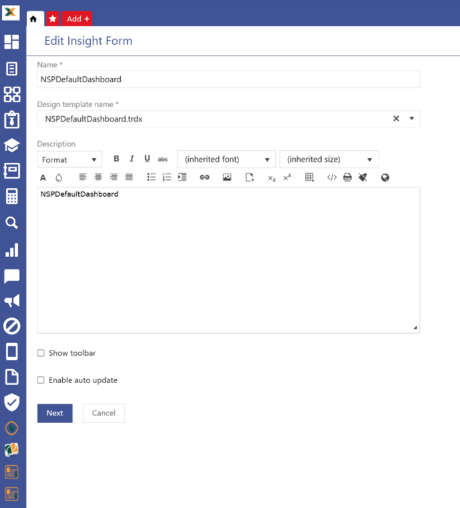
Insights Settings: Edit Insight Form
Actions in the Insights list
Each row in the list provides an actions menu. The available options are Edit, Delete, and Enable direct access. Enabling direct access allows NSP to generate a URL for the selected Insight so that it can be shared publicly. The list also shows whether an entry is marked as Default and whether direct access is already enabled.
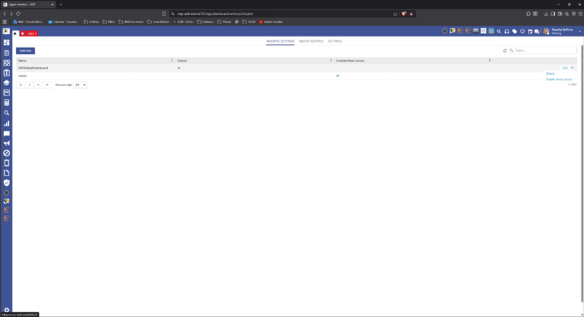
Settings: Row actions
Design Reports
The Design Reports tab opens the Telerik Web Report Designer inside NSP. This is where the dashboard layout is created and linked to a datasource. For complete details about report items, expressions, charts, styles, and advanced report design options, follow the Telerik Web Report Designer guide: Telerik Web Report Designer User Guide.
Creating a report from the provided template
NSP provides a default report template that can be used as a starting point. When creating a report, select From Template, browse to the Report Templates folder, and choose NSPTemplate.trtx. This is the fastest way to start with a ready-made layout structure.
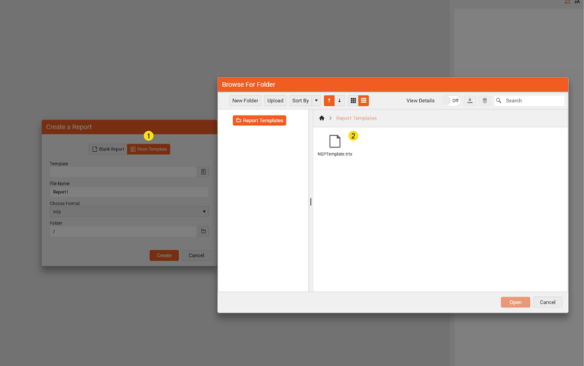
Design Reports: Create a report from the NSP template
Using shared data sources in a report
Reports can use Shared Data Sources so that multiple reports can reuse the same data connection. In the Explorer panel, browse to the Shared Data Sources folder, select the required .sdsx file, and then assign that datasource to the report from the Data > Data source property on the right-hand panel.
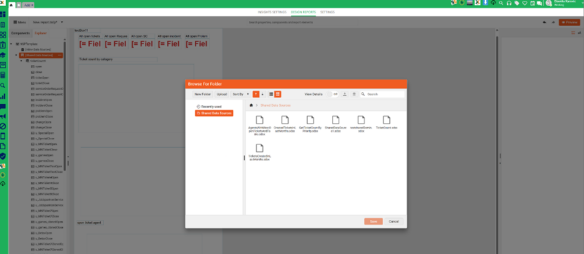
Design Reports: Selecting a shared datasource file
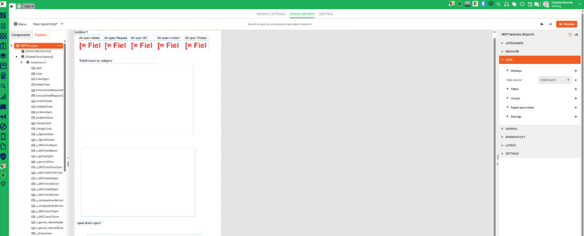
Design Reports: Report datasource assigned from Shared Data Sources
Creating the datasource for reporting
Datasource preparation is an important step and should be done before building the dashboard layout. In this example, the datasource is created as a Web Service Data Source. Open the datasource file, click Configure, and complete the configuration steps.
Step 1. In Configure Data Retrieval, enter the service URL in the following structure: @domain/ReportDesignerSource/AgentsWithMostOpenTicketsAndTasks?token=@token.
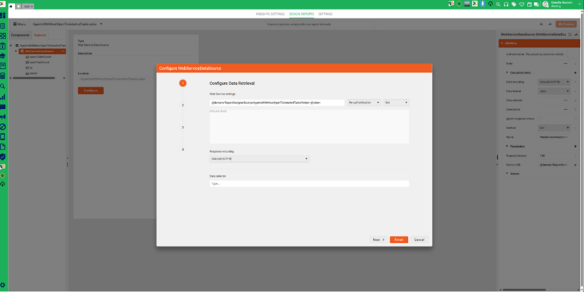
Datasource configuration: Step 1 - Configure Data Retrieval
Step 2. Configure the datasource parameters so the URL can use the NSP domain and token values dynamically.
|
Name |
Type |
Value |
|
@domain |
Inline |
=Parameters.domain.Value |
|
@token |
Inline |
=Parameters.token.Value |
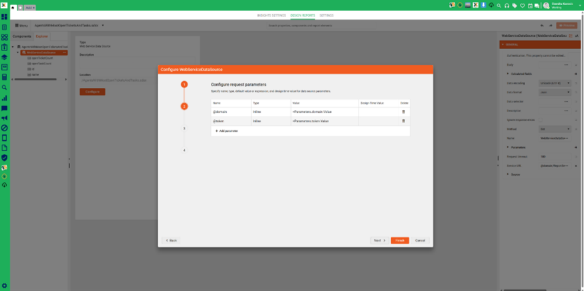
Datasource configuration: Step 2 - Request parameters
Step 3. Choose the design-time data. In this example “Use real data while designing the report” is selected, but the designer also allows a JSON file or inline JSON sample data when needed.
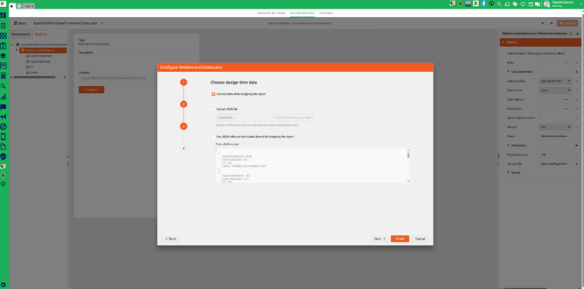
Datasource configuration: Step 3 - Design-time data
Reference note: For additional datasource options, chart configuration, expressions, and advanced report item settings, continue with the Telerik Web Report Designer User Guide.
Example: Building the Insights dashboard report
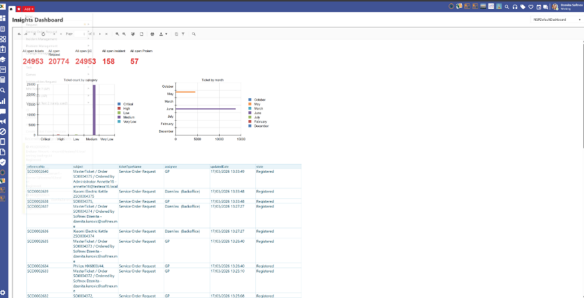
The following example shows a dashboard report with KPI Ticket counters at the top, a Ticket count by category chart, a Ticket by month chart, and an Open ticket list by agent section.
To have this report working, the following NSP datasources were needed:
1. ticketCount
2. getTicketCountbyPriority
3. createdTicketsInLastMonths
4. lastUpdatedTickets
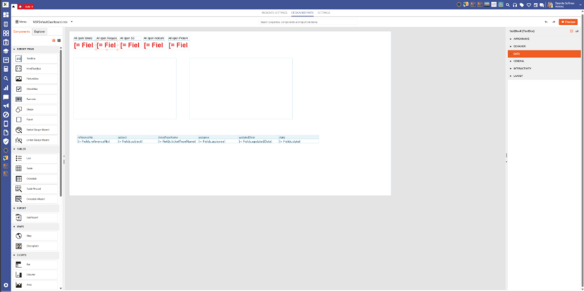
Design Reports: Example dashboard layout in the report designer
Ticket count by type (Textboxes)
1. Click on the Components and drag the textbox from the left panel to the central report section
2. Configure the field through the right panel:
a. Under Appearance rename the textbox to All open tickets, All open requests, etc. – These will be your headlines.
3. From the Explorer tab, under the headline drag the data source field to the central report section, for example „open“, „close“.
4. Adjust formatting, data bindings, size, and layout from the properties panel on the right.
5. Repeat the steps for all other fields: All open requests, All open SC tickets, etc. by choosing the appropriate parameters, e.g.,
6. Menu: Click Save from the dropdown to save changes to the report.
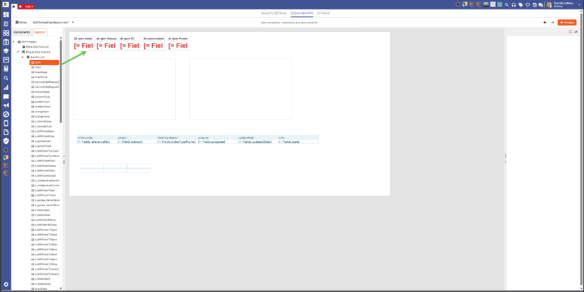
Design Reports: Textbox configuration (All open tickets)
Ticket count by category (Graph)
1. Drag the Column from the Components tab in the left panel to the central report section
2. Configure the graph through the right panel:
a. Data source: getTicketCountbyPriority
b. Drag the appropriate fields to the Categories, Series and Values section
c. Adjust formatting through the Appearance section.
d. Click Create and check your graph by clicking the Preview button (top right)
3. Menu: Click Save from the dropdown to save changes to the report.
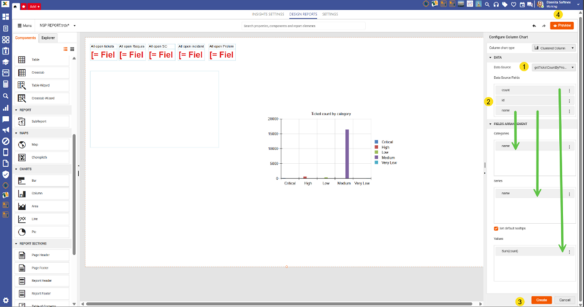
Design Reports: Graph configuration (Ticket count by category)
Ticket count by month (Graph)
1. Drag the Bar from the Components tab in left panel to the central report section
2. Configure the graph through the right panel:
a. Data source: lastUpdatedTickets
b. Drag the appropriate fields to the Categories, Series and Values section
c. Adjust formatting through the Appearance section.
d. Click Create and check your graph by clicking the Preview button (top right)
3. Menu: Click Save from the dropdown to save changes to the report.
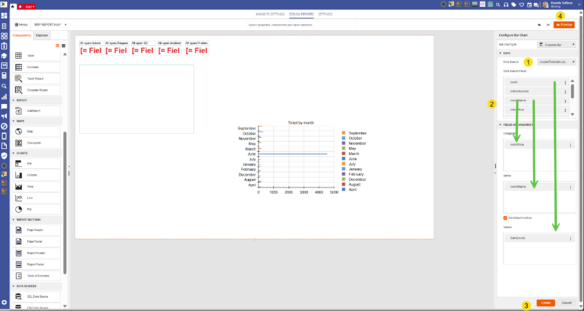
Design Reports: Graph configuration (Ticket count by month)
Last updated ticket list (Table)
1. Components tab: Drag the Table from the left panel to the central report section
2. Configure the Table by clicking the Table Wizard through the right panel:
e. Data source: lastUpdatedTickets
f. Drag the appropriate fields to the Detail Values section.
g. Adjust formatting through the Appearance section.
h. Click Create and check your table by clicking the Preview button (top right)
3. Menu: Click Save from the dropdown to save changes to the report.
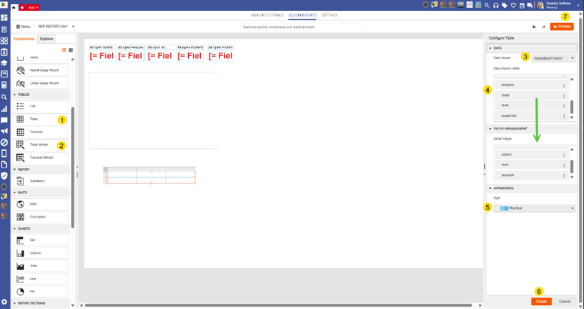
Design Reports: Table configuration (Last updated ticket list)
If the report is created from NSPTemplate.trtx, placeholders for the layout may already exist, which makes it easier to replace them with the required data-bound elements.
Interactivity
When a report item should trigger navigation or another custom action, configure it from Interactivity. In this example, the item uses:
• Action > Type = Custom action
• Parameter name = ticketId
• Parameter value = =Fields.Id
This setup allows NSP to pass the current ticket ID from the datasource to the custom action.
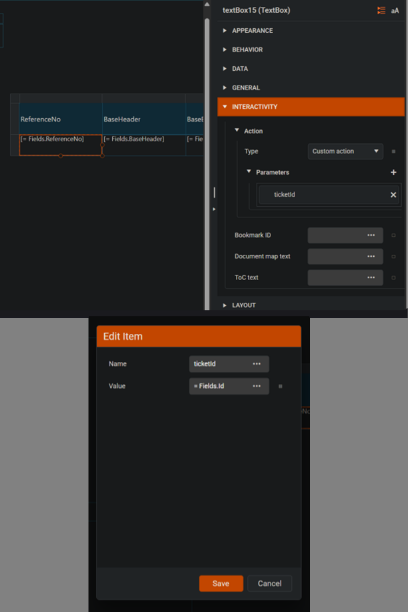
Design Reports: Interactivity with custom action and ticketId parameter
Settings tab
The Settings tab contains the technical items used by Insights reporting:
• Token - used in report datasource calls. The value can be copied, and a new token can be generated if needed.
• Override file - restores the default NSP template and datasource files. Clicking Override files replaces the existing files with the default ones or recreates them if they were deleted.
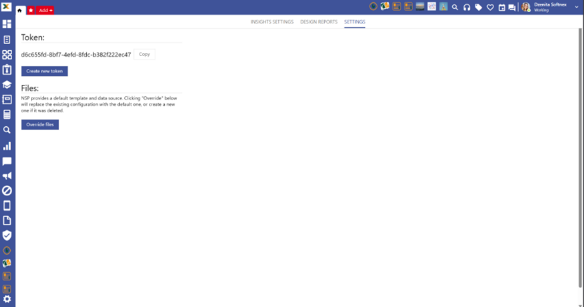
Insights: Settings tab
Insights Dashboard view
After the report is connected, the Insight entry is created, and the dashboard is selected in NSP, the finished report is displayed in the Insights Dashboard viewer. Users can choose the dashboard from the dropdown list and use the viewer toolbar if it is enabled for that Insight.
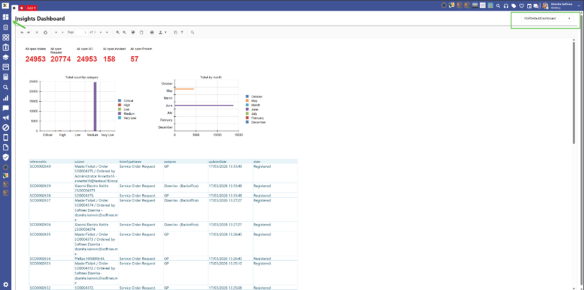
Insights Dashboard: Example of the finished dashboard