 ) provided on the left
sidebar:
) provided on the left
sidebar:Using Reports, you can monitor daily ticket activity, helpdesk overview, survey results and so on. Reports are detailed snapshots of collections of tickets within a time period.
Reports are made up of graphs and ticket lists. Graph shows the visual representation of data and the list shows the same data in a tabular form. Various ticket properties are used to represent reports. User feedback on service is displayed using survey report. Reports also provide various filter options like time interval and submission method.
To access Reports page, click button () provided on the left
sidebar:
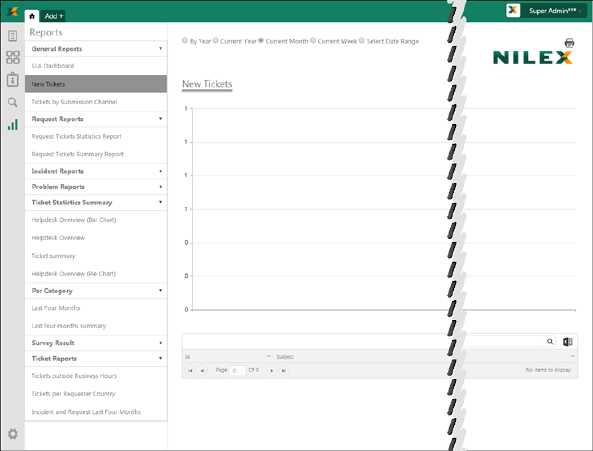
Reports
The Reports page is divided into two sections. The left section contains links to various Reports categorized into different groups and right section displays the selected Report.