This report includes the analytical data for the responses provided on the survey by users who have used the services of NSP i.e. created tickets. This report provides a chart showing response of different users on each question of the survey form.
Survey Result
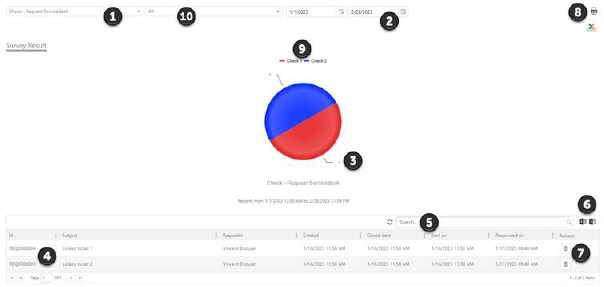
This report displays feedback from users on survey. A dropdown list (1) is provided to filter the content. The dropdown list contains questions of the survey form. The data and graph is displayed based on the selected question. If the selected question is multiple choice or list, then pie chart is displayed whereas a bar chart is displayed in case of multi-select question. The first question of the survey form is selected by default in the dropdown and the report is displayed for this selection.
Just next to question dropdown is Group dropdown list (10) which provide you to filter survey results by assignee groups.
Mouse over any bar or sector displays a label (3) containing response and respective count.
The label above the graph represents various responses (9). The above figure shows only one option “yes” right now as all the respondents have responded “yes” for the selected question. Similar to other reports, clicking on the label shows or hides the respective data on the chart.
Date filters (2) are provided beside the questions dropdown. You can select the start date and end date in the date filter. Based on the selected dates report will be filtered comprising only data which are responded between the duration of selected dates.
All the survey response given and represented in the graph is listed just below the graph (4). Each item in the list includes Id, Subject, Requester, Created Date, Closed Date, Survey Sent Date, Survey Response Date and Actions, containing the Details action (7), viewing the details of the survey. More on this is explained in Survey Detail section.
The list also provides a search box (5) and an export to excel button (6).
There are two export to excel buttons: Export to Excel (All questions) which exports all questions and answers and second button Export to Excel which exports single question and answers based on selected question in dropdown.
Use Print button (8) to open the print utility. You can do required changes and make a print out of the report.