When you login to NSP web portal, Dashboard screen is the start page. Dashboard screen contains the overall summary of current activities in the system. The Dashboard screen is divided into four major sections. These sections are:
•Summary Stats
•Ticket/Task List
•My latest updated tickets
•Topic and Ticket Search result
This section describes the Summary Stats section.
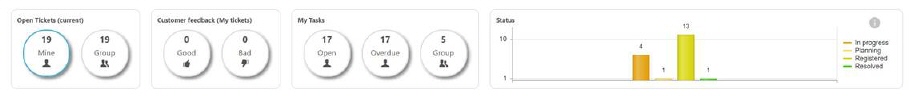
Summary Stats contains icons with numbers indicating number of tickets or tasks in different groups. Four different parts could be displayed: Open Tickets, Customer Feedback, My tasks and Status widget. Agent can select which of the parts should be displayed. This setting is part of User Profile Setting, see section Dashboard Widget Configuration.
Below figure shows the Summary Stats view.
Summary Stats
There are four parts in this view: Open Tickets, Customer Feedback, My Tasks and Status widget. These parts are each divided into sub parts. Clicking any of the stat will display ticket/task list on the dashboard just below the summary, filtered based on the selected stat.
Customer Feedback shows number of feedbacks given by End Users current week.
When you first login the list containing your open tickets (Mine) is displayed.
Ticket status widget shows in graph all tickets statuses which are currently visible in selected list.
By clicking on the selected status, the list will be
filtered and will show only tickets that have the selected status. By clicking on button Clear on the widget  you
will get back to the previous widget view with all ticket statuses.
you
will get back to the previous widget view with all ticket statuses.
Read more: